OEE and efficiency are more than just buzzwords; they are a measurable driver of productivity, cost control, and competitiveness. To monitor and improve operational performance, our Connect MES-system provide a range of Key Performance Indicators (KPIs) that help production teams understand how well machines, production line, shifts are performing. These KPIs are not only useful for tracking performance over time, but also to identify losses and problems, to benchmark and compare performance and for trend analysis.
OEE
(Overall Equipment Effectiveness)
OEE is available for plastics and is used to measure how effectively a manufacturing operation is utilized in the available time. It combines three critical factors (Availability, Performance and Quality) into a single percentage that reflects the overall efficiency. Each component is expressed as a percentage. The final OEE value typically ranges from 0% to 100%., but can exceed 100% for example if the machine runs faster than its standard speed (resulting in a high P), while A and Q are high.
Formula: OEE = Availability x Performance x Quality
With the example values below, OEE is 75% x 125 % x 95% = 89%.
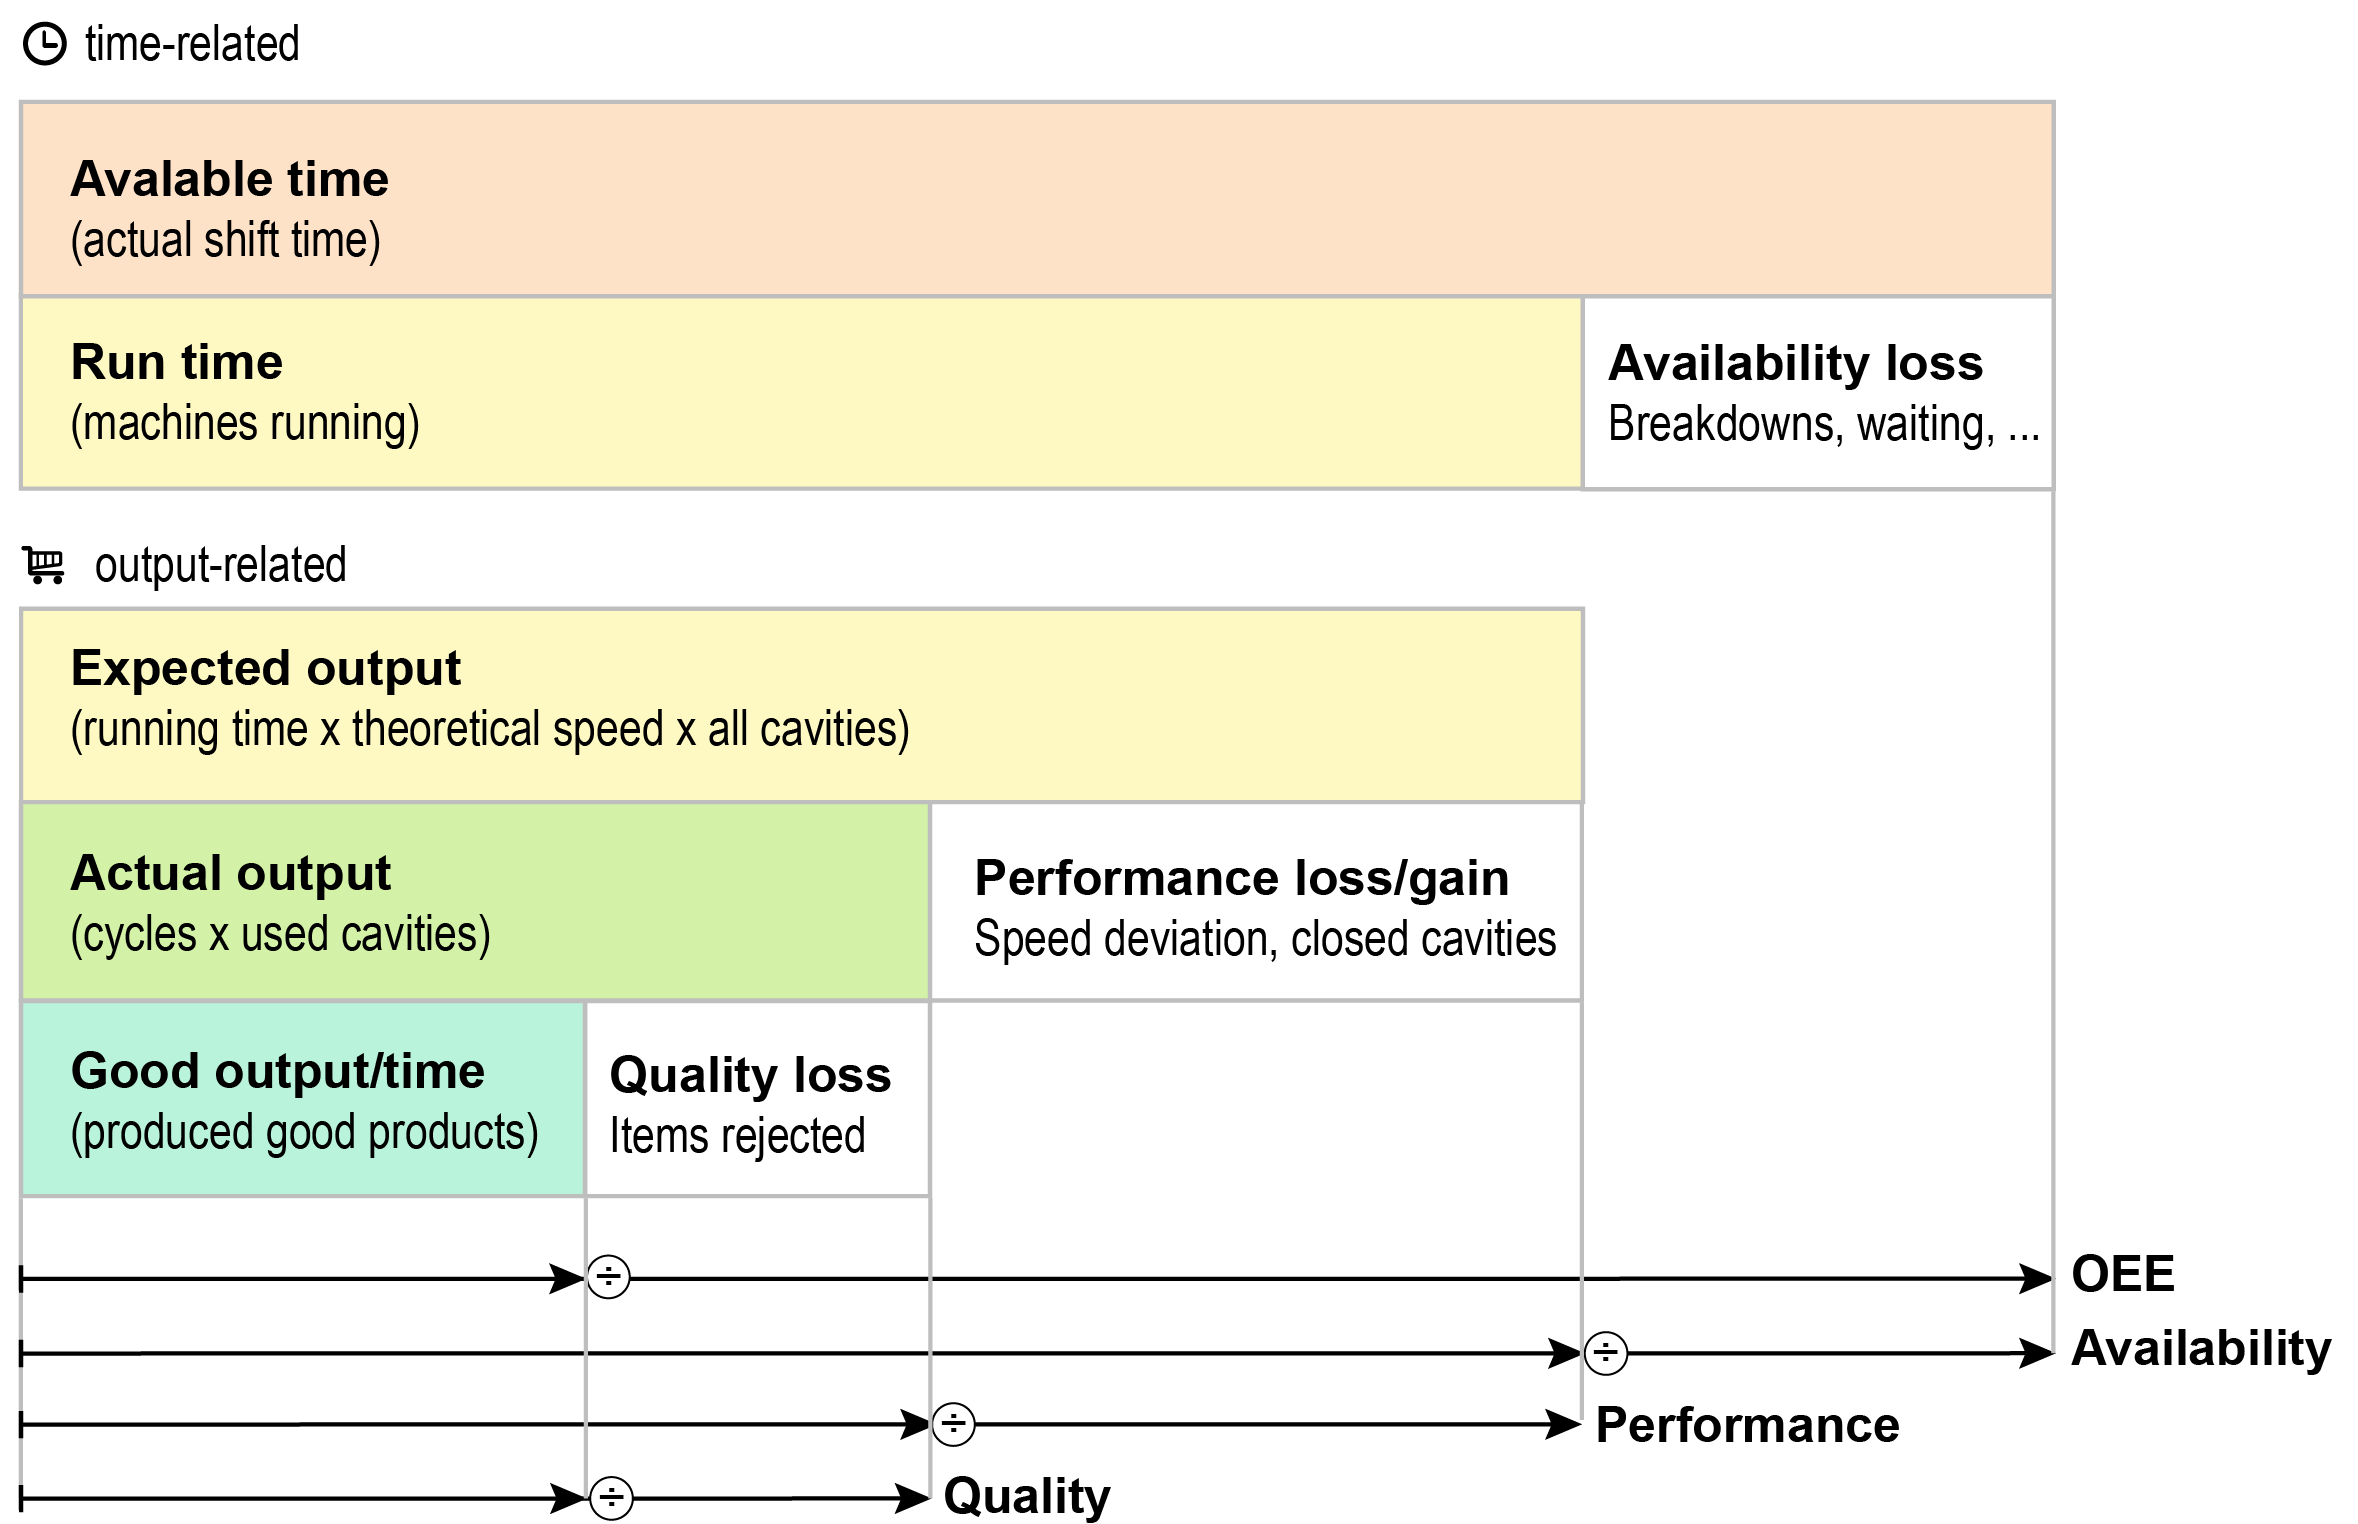
Availability
Measures the percentage of available time that the machine is actually running.
Losses include: unplanned downtime, setup/changeover time.
Formula: Run time / Available time
Example: If a machine is scheduled for 8 hours but runs for only 6 due to a mold change and a breakdown, availability is 75%.
Performance
Measures how fast the machine runs compared to its ideal cycle time and the full capacity of the tool.
Losses include: speed deviation, closed cavities, micro-stops.
Performance can exceed 100% if the mean cycle time is shorter than the standard cycle time, or in other words the produced quantity is higher than the theoretic maximum quantity, which indicates that the machine is running faster or is creating more output than expected. This can indicate that the standard cycle time is too pessimistic.
Formula: Actual output / Expected output
Example: If the ideal cycle time is 10 seconds (production of 360 pieces per hour) but the machine consistently runs at 8 seconds (production of 450 pieces per hour), performance may be 125%.
Quality
Measures the percentage of good parts produced out of the total.
Losses include: scrap, rework.
Formula: Good output / Actual output
Example: If 950 out of 1000 parts are good, quality is 95%.
OOE and TEEP
Although Connect does not provide OOE and TEEP as standard KPIs, it's useful to understand these metrics as part of the broader efficiency landscape in manufacturing.

OOE
(Overall Operations Effectiveness):
Measures how effectively equipment is used during the operating time. It includes all time the equipment could be running, including unscheduled time. It’s often used for operational benchmarking and identifying underutilized capacity.
Formula: Good time / Operating time
TEEP
(Total Effective Equipment Performance):
Considers the total calendar time, giving insight into the theoretical maximum utilization of equipment. TEEP is valuable for long-term capacity planning and strategic decisions, such as evaluating whether additional shifts or machines are needed.
Formula: Good time / All available time
Efficiencies
While for plastics, OEE provides a comprehensive view of equipment performance, it's also useful to look at machine efficiency and operator efficiency as separate indicators. These efficiencies are available for all machine types and help pinpoint whether performance issues are related to equipment limitations or human factors.
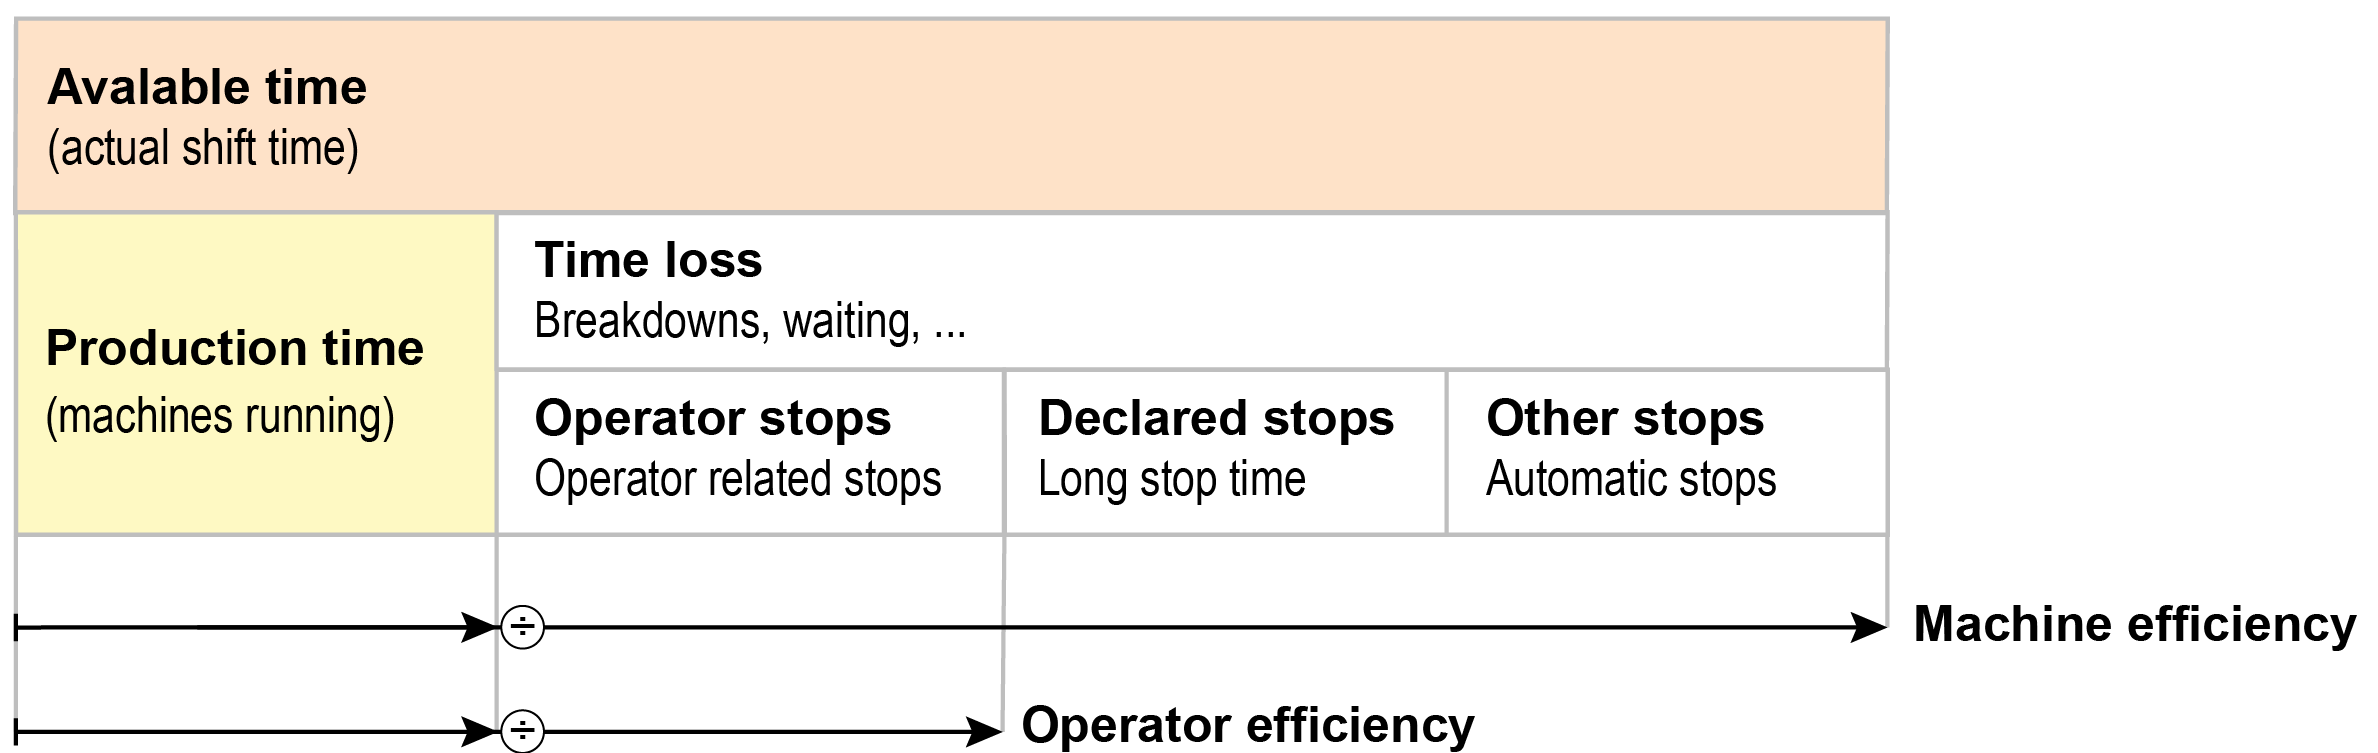
Machine efficiency
Measures how effectively a machine converts operating time into productive output, based on its theoretical capacity and is useful for real-time monitoring and short-term performance analysis.
Formula: Actual production time / Scheduled time
Example: During the 8 hour shift, a total of 2 hours was lost due to stops. The actual production time is 6 hours and the Machine efficiency is 6 / 8 = 75%.
Operator efficiency
Reflects how productive an individual operator is during the shift, based to expected output. This value is often used for shift comparisons.
Formula: Actual production time / (Actual production time + Operator stop time)
Example: During the 8 hour shift, a total of 1 hour was lost due to operator related stops, and 1 hour was lost due to other stops. The Operator efficiency is 6 / (6 + 1) = 85.7
KPI comparison table
To help you understand the differences between the various efficiency KPIs tracked in our MES system, the table below provides a side-by-side comparison. This overview is useful for selecting the right KPI.
| KPI | Focus | Time basis | Includes downtime? | Use case |
| OEE | Equipment | Scheduled production time | Yes | Daily performance tracking: how well equipment performs when scheduled? |
| Machine efficiency | Equipment | Operating time | No | Real-time monitoring |
| Operator efficiency | Human | Shift time | No | Workforce optimization |